This chapter explains the general project settings.
Contents
6. Visualize deviations from main alternative
10. Visualize parameter deviations
11. Highlight value-adding processes
The following validation settings can be enabled or disabled here:
•Connection constraints
oIf enabled, when creating a model, the objects to which valid connections can be created are highlighted.
oIf the check box is unchecked, all links can be used. Link validation is then completely disabled.
oThis can result in value streams being generated that cannot be simulated.
•Control constellations
oIf this option is enabled, a warning icon is displayed in the modeling interface for invalid control constellations.
oDetails can be found in the chapter Handling value stream objects in Section 5. Plausibility check visualization.
•Product definitions
oWhen this option is enabled, a warning icon is displayed in the modeling interface for invalid product transitions.
oDetails can be found in the chapter Handling value stream objects in Section 5. Plausibility check visualization.
The check boxes Show grid, Snap to grid and Highlight value-adding processes have an effect on the representation of the modeling (see Figure 8).
By activating this option, a grid is displayed in the modeling interface, which can simplify the arrangement of objects.
If the option is enabled, objects in the modeling interface are automatically aligned to the grid, which can simplify the arrangement of objects.
If the option is activated, an X and Y axis is displayed at the zero point in the modeling interface.
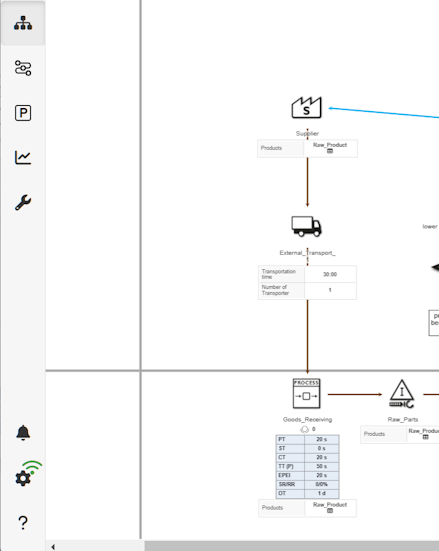
Figure 1 - Axes shown
If the option is activated, guides will be displayed in the modeling area to help arrange the elements in parallel.
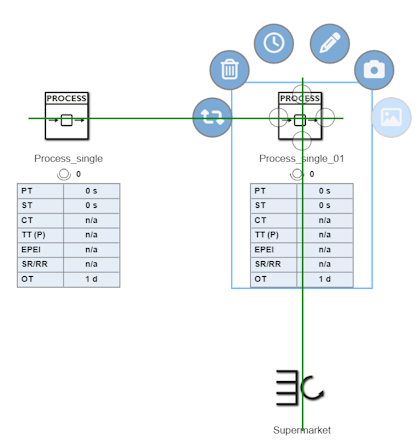
Figure 2- Guided drag & drop
6. Visualize deviations from main alternative
In the other alternatives, each parameter value is compared with the corresponding parameter value from the reference alternative.
The link exists via the module name and types (class): Each parameter is compared with the parameters of the module with the same name and types in the reference model.
If no object with the same name/types exists in the reference model, the object in the current alternative is marked with a red square icon ![]() in the current alternative
in the current alternative
A blue square icon ![]() is displayed above the object if the following conditions are met:
is displayed above the object if the following conditions are met:
•At least one parameter of the object has a different value than in the main alternative.
•The Visualize deviations from main alternative check box is active
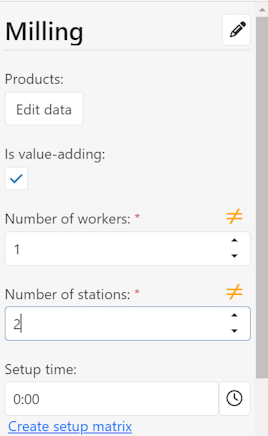
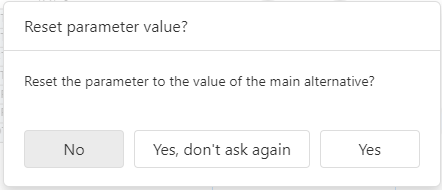
Using the edit menu/side menu, the user can view these deviations and either change them manually or reset them to the original values by clicking the ≠ icon ![]() to reset them to the original values.
to reset them to the original values.
Figure 3 - Icon |
Figure 4 - Revert |
Figure 5 - Dialog
Figure 6 - Info |

Use the drop down menu to specify which KPIs should be displayed in the modeling interface under the respective object.
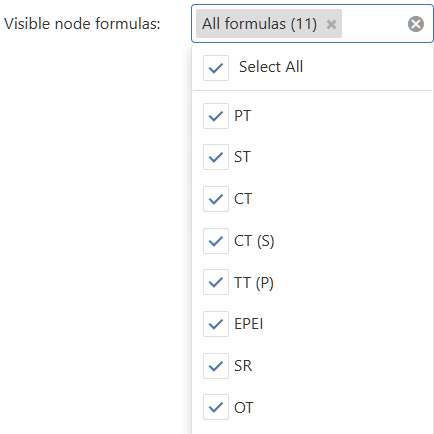
Figure 7 - Visible KPIs
For further information on the lead time display, please refer to the chapter Time line of modeling within the static key figures.
The automatically generated display of the throughput time below the value stream objects can be parametrized via a drop-down menu to the entries None, Simple and Multiple layers:
Option |
Description |
None |
Hides the throughput time display under the value stream objects completely. |
Simple |
A throughput time display is created for the entire value stream model in a modeling alternative. If parallel model constellations (in flow direction) occur, it can happen that static cycle times on the flow grade curve overlap on a deflection, since the minimum width of a deflection does not allow an unambiguous assignment of individual objects. For these cases the third mode Multiple layers is recommended. |
Multiple layers |
In this mode, several horizontal layers are automatically generated within the modeling surface, for each of which a flow grade curve or a throughput time display is generated. The assignment to a layer or a flow grade curve (including the static calculations) is controlled by the position of the object icon. |
Via the option Lead time layer height the height of the marking of the respective level can be parametrized (see figure 8).
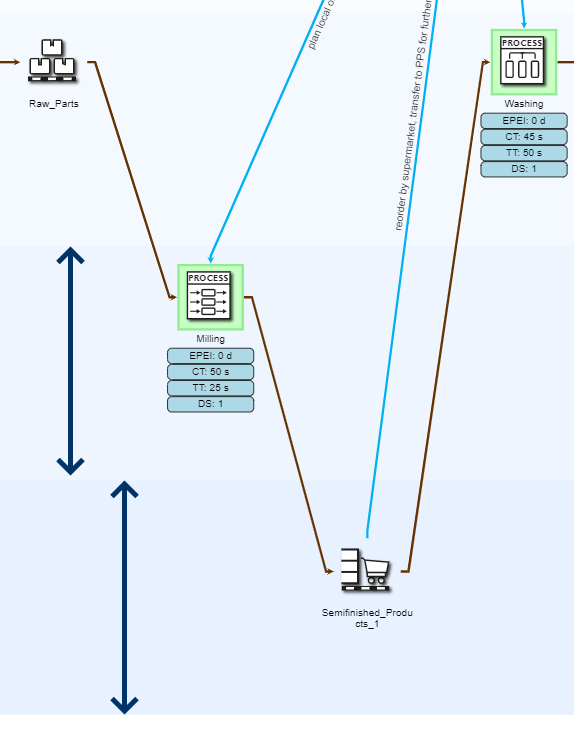
Figure 8 - Height of the marking
10. Visualize parameter deviations
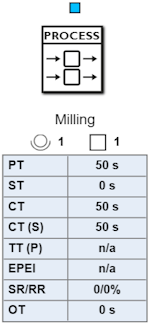
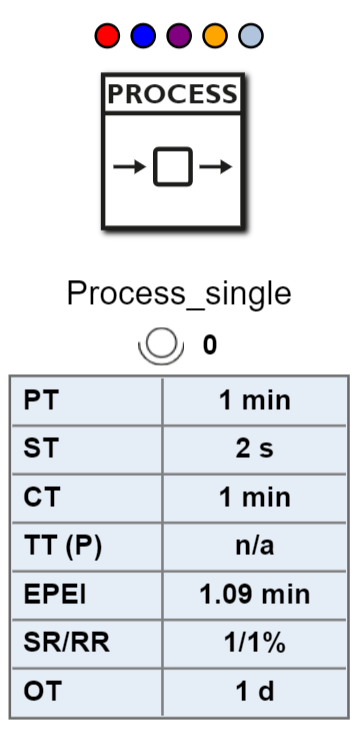
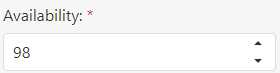
If predefined parameter values deviate from a standard value, colored markings are displayed for subsequent items.
In this way, the user can immediately identify the items where bottlenecks/obstacles/problems may occur.
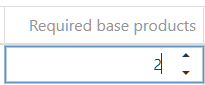
•Process (single)
•Process (multiple)
•Process (assembly)
•Process (dis-assembly)
•Process (clocked)
•Process (lead)
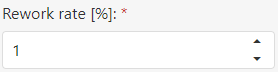
•Rework
|
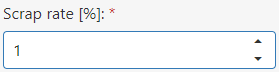
Note: Since several products can be assigned to a process, it is sufficient for a single product to have a scrap or rework rate > 0 in order to receive the color code. |
|
|
11. Highlight value-adding processes
If this option is active, value-adding processes are highlighted graphically in the modeling interface (see Figure 9).
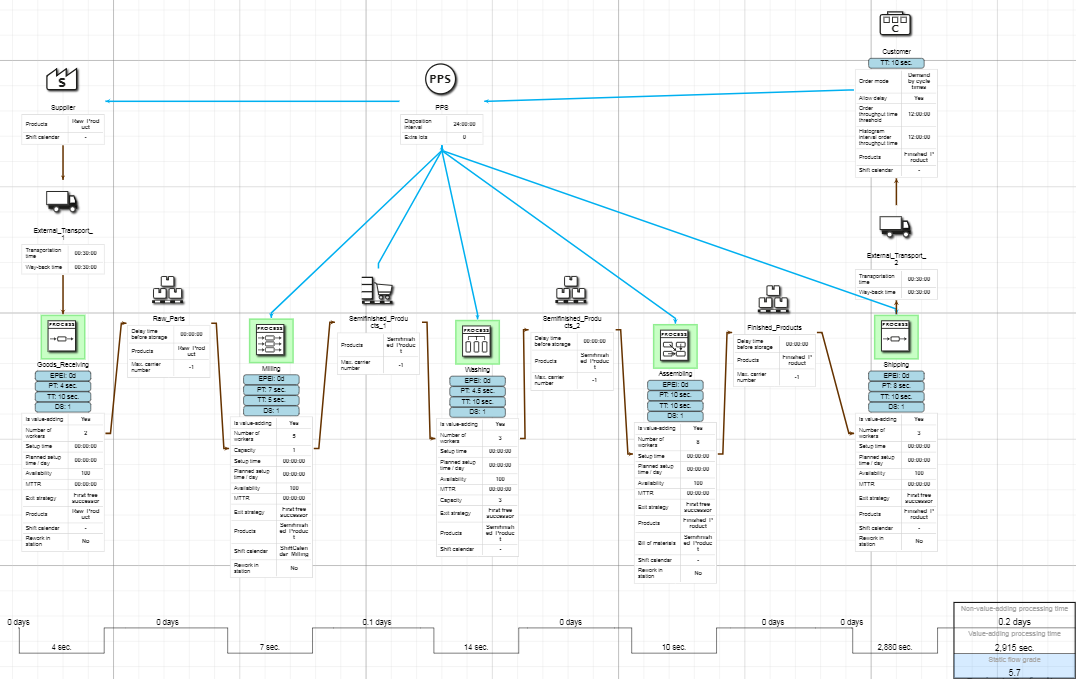
Figure 9 - Options Show grid and Highlight value adding processes active
© SimPlan AG - Hanau District Court, Commercial Register (Part B) 6845 - info@simplan.de - www.simplan.de/en