This results section contains a table with a first overview of the simulation run of the alternative with simulation start, simulation end and statistics reset.
Figure 1 shows the section Simulation overview with expanded tree structure. An overview of the available simulation results is given here.
Alternative modelling can be added to the results at any time, as described in Selection and comparison of dynamic key figures (alternative selection and comparison).
A click on a column heading sorts the contents of the respective column in ascending or descending order.
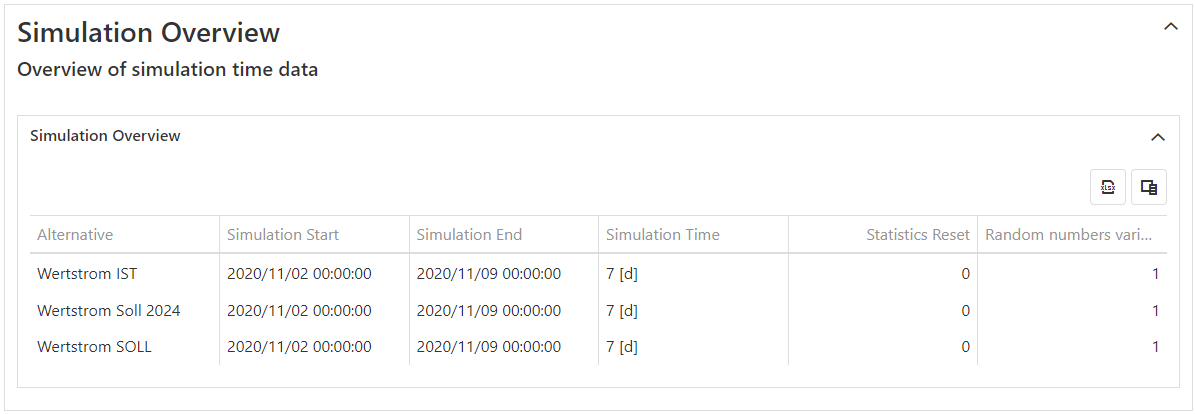
Figure 1 - Simulation overview
The Excel button |
|
opens the explorer and the currently selected statistic can be saved directly as xlsx file. |
The column button |
|
opens a new window in which unwanted columns of the table can be moved by drag & drop |
As soon as the columns are added back to the table, they are automatically set to their original position.
© SimPlan AG - Hanau District Court, Commercial Register (Part B) 6845 - info@simplan.de - www.simplan.de/en