This chapter describes and explains the selection and comparison of dynamic key figures
Contents
Figure 1 shows the simulation results after the simulation has run successfully.
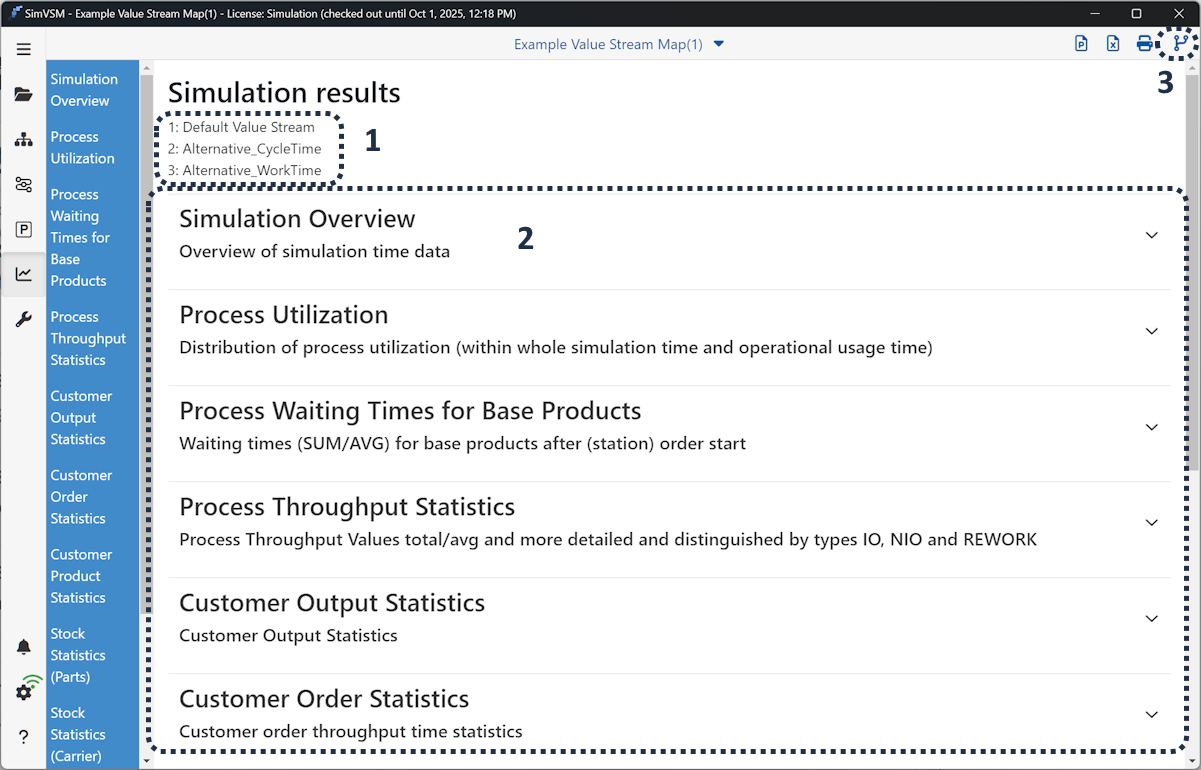
Figure 1 - Overview simulation results
1 |
The name of the modeling whose results can be viewed is displayed directly below the title |
2 |
The largest area in the simulation results is intended for the representation of the same. Here, all result categories listed in the menu on the left are displayed in a hinged tree structure. Detailed descriptions of each individual category can be found in the following chapters. |
3 |
The button Alternatives can be used to show or hide alternative models in the simulation results. The prerequisite for this option is that the alternatives have been simulated beforehand (see Figure 2). |
|
The PowerPoint button exports all currently unfolded statistics as a PowerPoint file |
|
The Excel button exports all currently unfolded statistics as a Excel file |
|
The print button prints all currently unfolded statistics |
By clicking on the Alternatives button in the upper menu, a window appears on the right-hand side in which you can choose between the existing, simulated models.
By placing a check mark on a model, it will be added to the results, identified by the title under the title (Simulation Results).
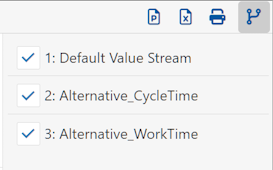
Figure 2 - Selection of alternatives
In order to compare alternatives, they must first be added to the simulation results as can be seen in figure 2.
Then the existing tree structure of the simulation results can be expanded (see Figure 3) and the selected alternatives can be compared.
The results are displayed in the order in which the modeling alternatives are listed. This order can be adjusted in the modeling interface in the alternatives menu.
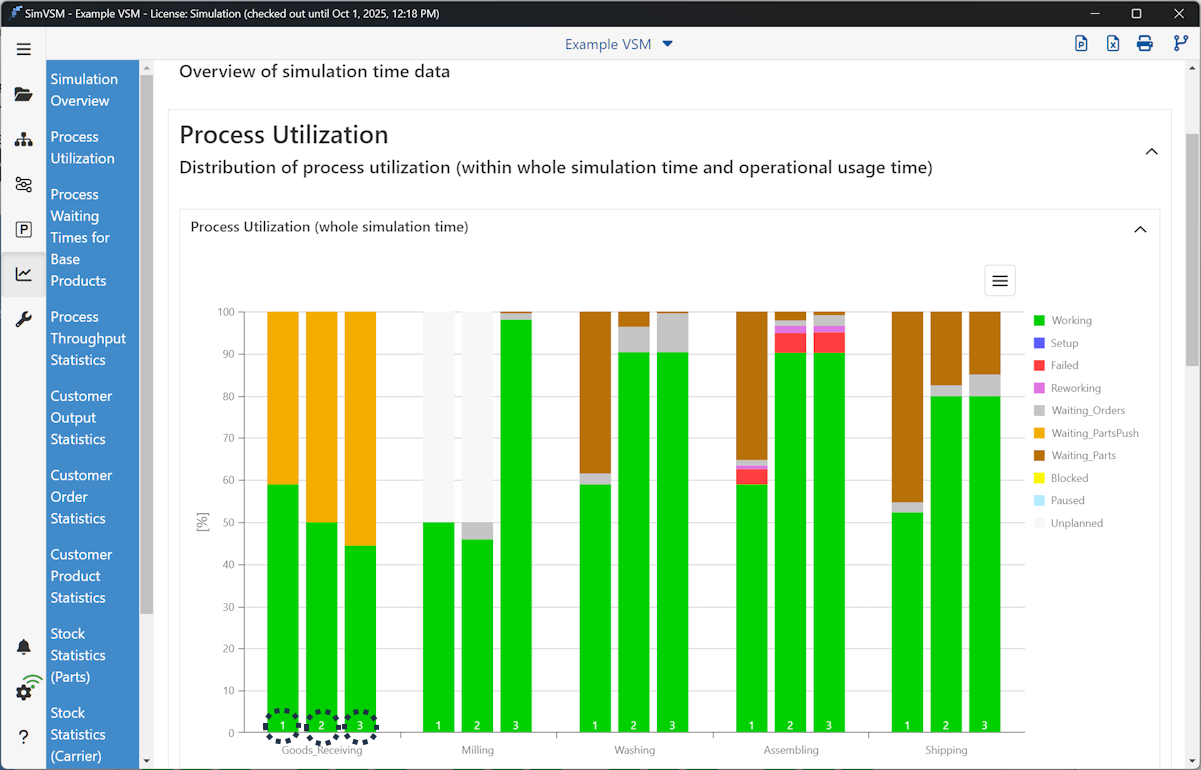
Figure 3 - Comparison of alternatives
© SimPlan AG - Hanau District Court, Commercial Register (Part B) 6845 - info@simplan.de - www.simplan.de/en