Contents
Visualization of different states of station
Visualization of different failure possibilities of a station
Visualization of different states of station with shift calendar
Time line for constellations with setup or change over time
|
Note: For further information see also chapter: Process Utilization |
Visualization of different states of station
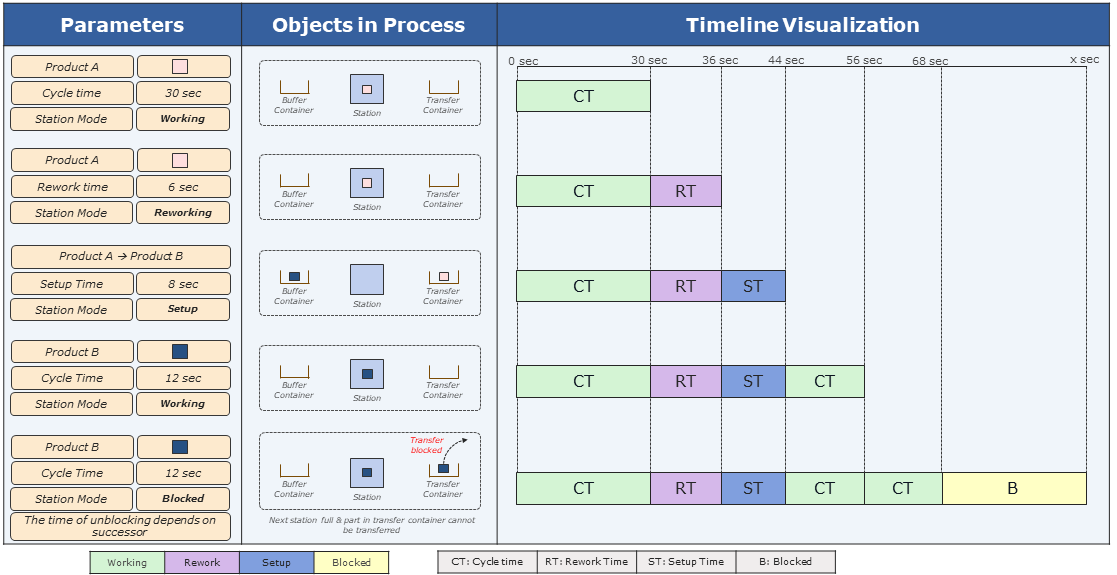
Figure 1 - Visualization of different states of station
Visualization of different failure possibilities of a station

Figure 2 - Visualization of different failure possibilities of a station
Case 1 : Failure with MTTR 5 min
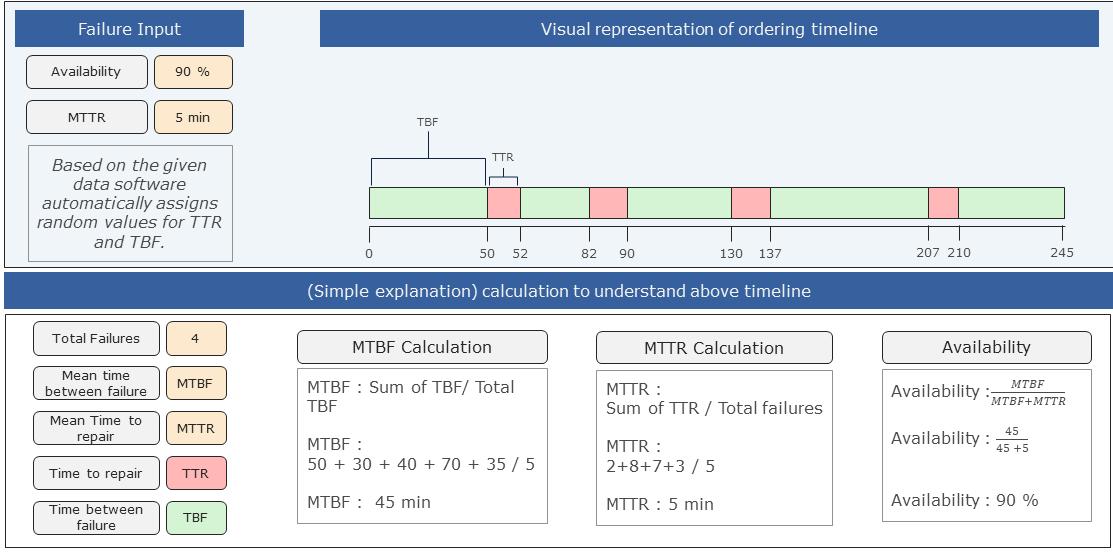
Figure 3 - Case 1 : Failure with MTTR 5 min
Case 2 : Failure with MTTR 20 min
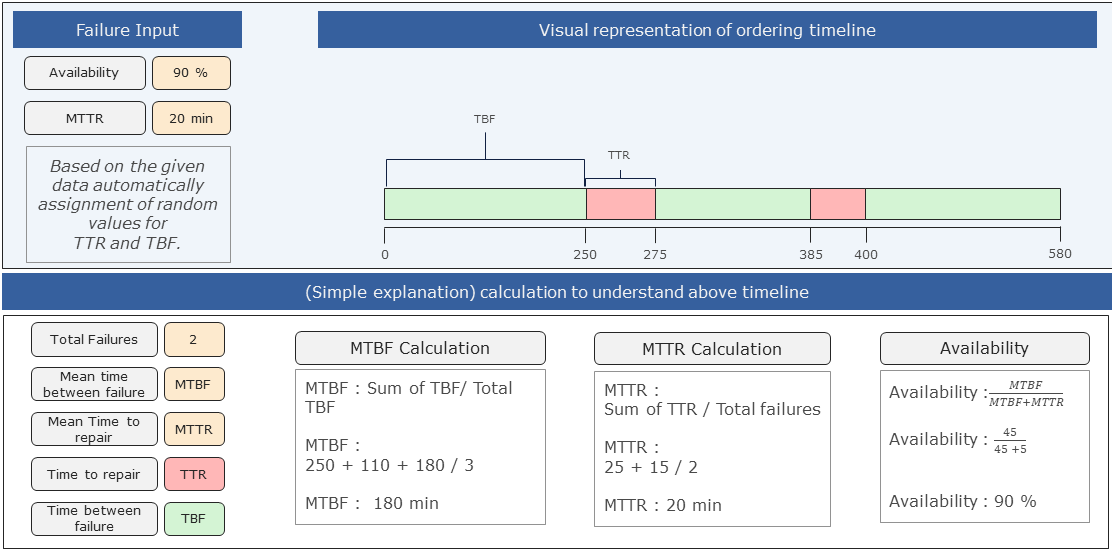
Figure 4 - Failure with MTTR 20 min
Case 1 : Failure with MTTR 5 min
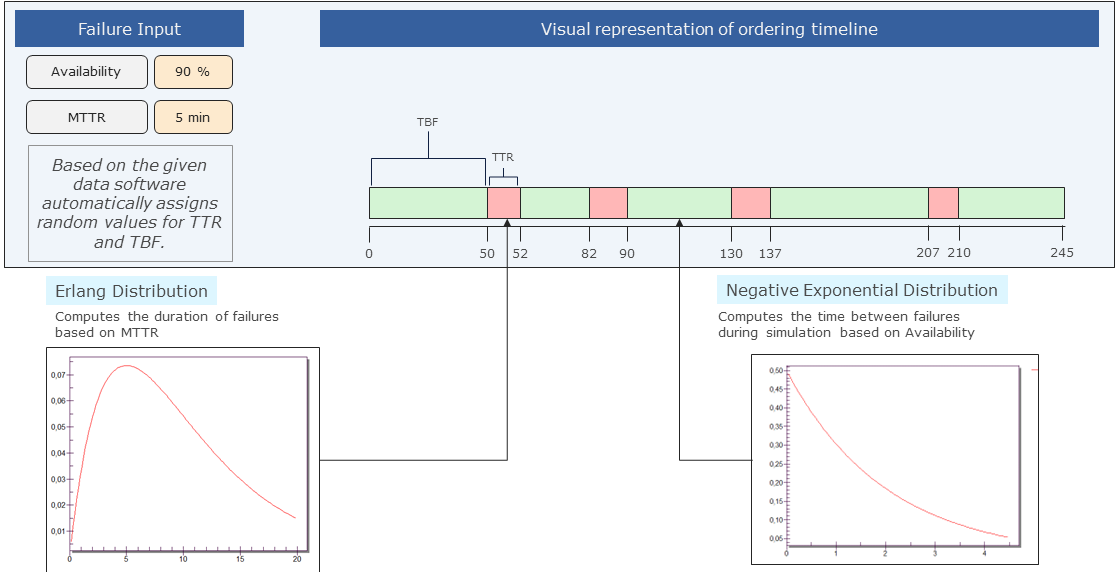
Figure 5 - Case 1 : Failure with MTTR 5 min
Visualization of different states of station with shift calendar
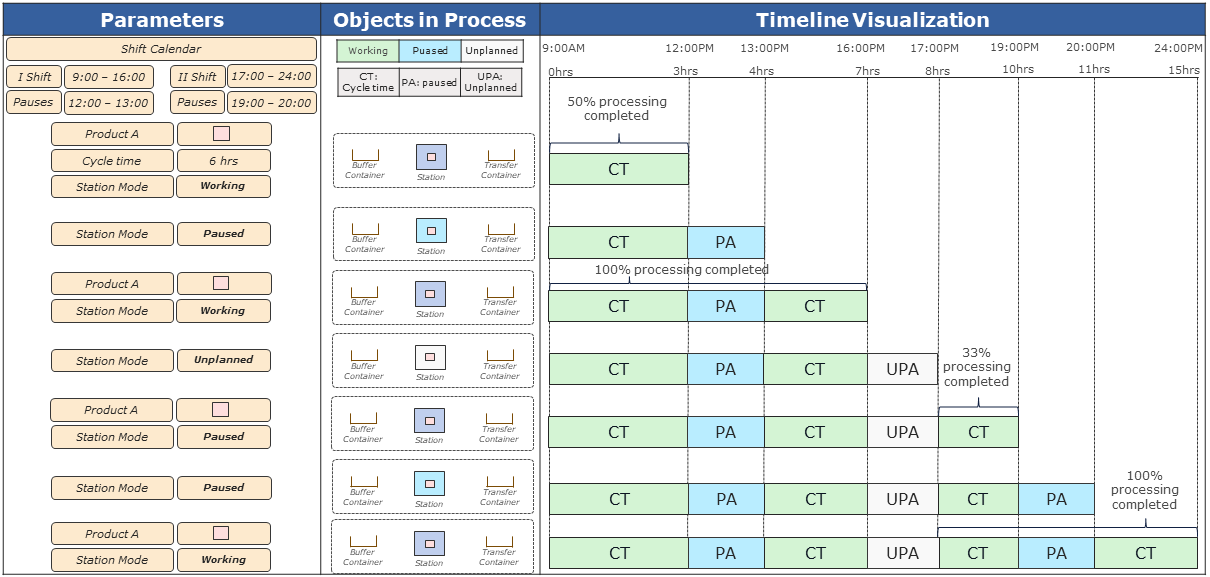
Figure 6 - Visualization of different states of station with shift calendar
Time line for constellations with setup or change over time
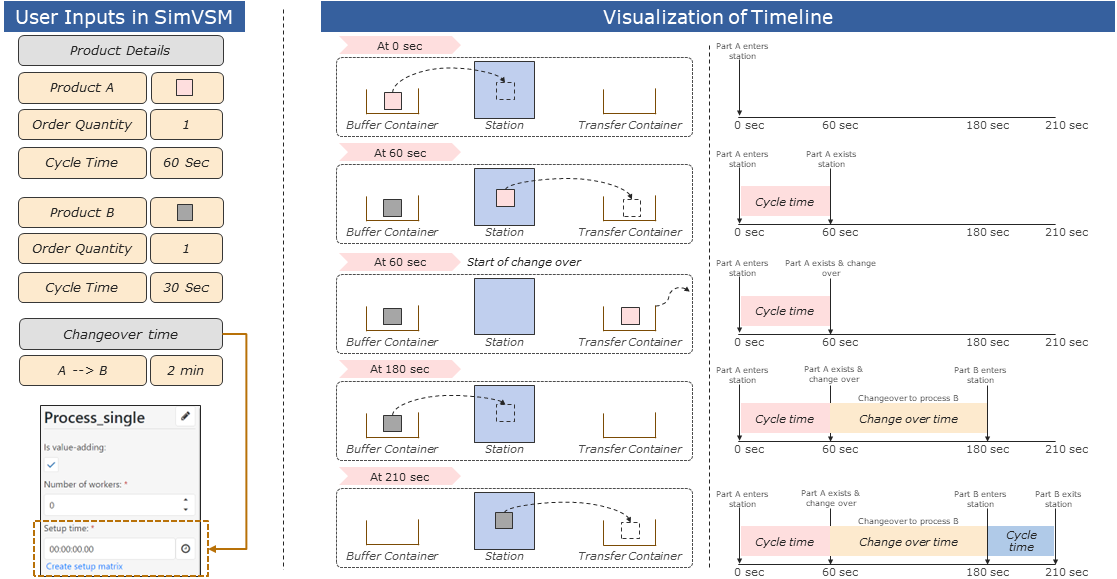
Figure 7 - Time line for constellations with setup or change over time
© SimPlan AG - Hanau District Court, Commercial Register (Part B) 6845 - info@simplan.de - www.simplan.de/en