This results section contains throughput statistics for individual customer objects and for the entire system as cumulative or averaged values for all customers.
This provides an overview of the systems total throughput as the cumulative throughput of all customers.
Contents
1. Overview total product throughput of system
2. Overview average product throughput of system per [h] in simulation time
3. Overview total product throughput of customers
4. Overview average input of customers per [h] in simulation time
5. Customer – Throughput parts (IO, REWORK) in [h]
6. Customer – Throughput parts (IO, REWORK) in [d]
Figure 1 shows an overview of individual distributions of the key figure customer throughput.
Figure 1 - Customer throughput overview
1. Overview total product throughput of system
In addition to the total throughput (Figure 2), the next diagram (Figure 3) also shows the average total throughput of the system per hour.
In contrast to process objects, the reference time here refers to the entire simulation period (minus a possible statistics reset).
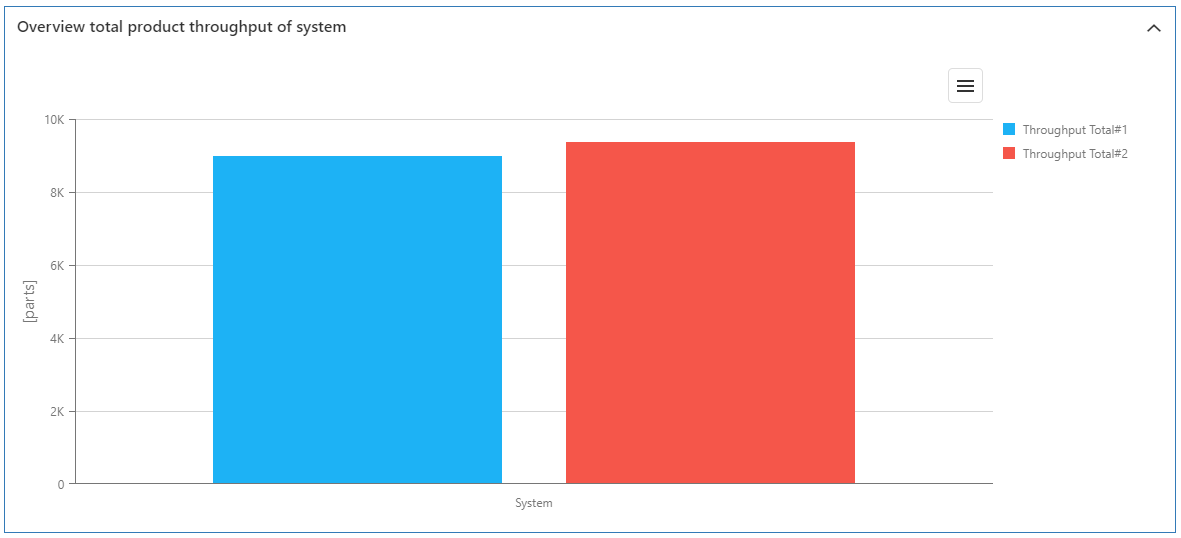
Figure 2 - Overview total product throughput of system
2. Overview average product throughput of system per [h] in simulation time

Figure 3 - Overview average product throughput of system per [h] in simulation time
3. Overview total product throughput of customers
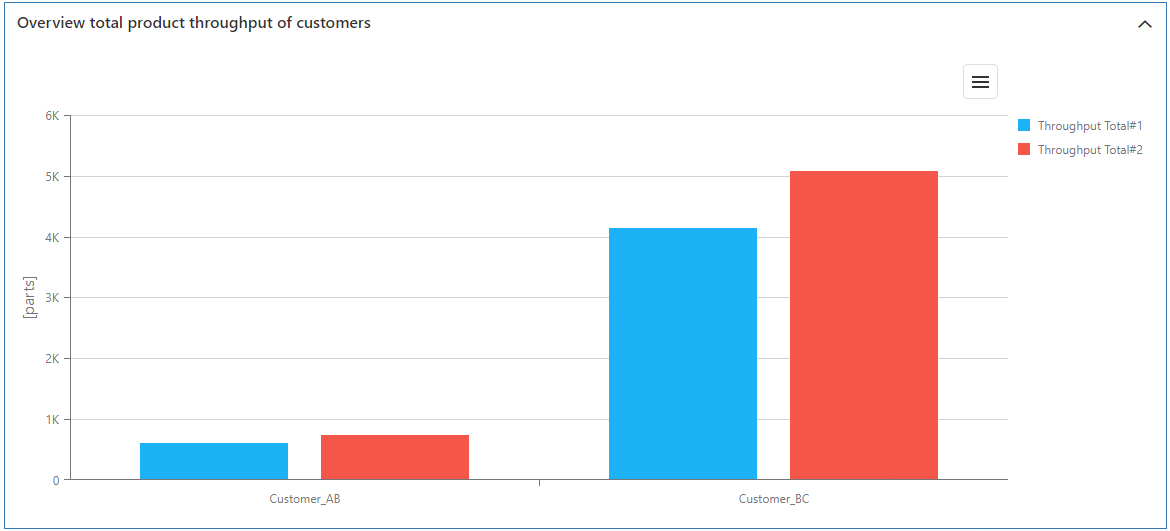
Figure 4 - Overview total product throughput of customers
4. Overview average input of customers per [h] in simulation time
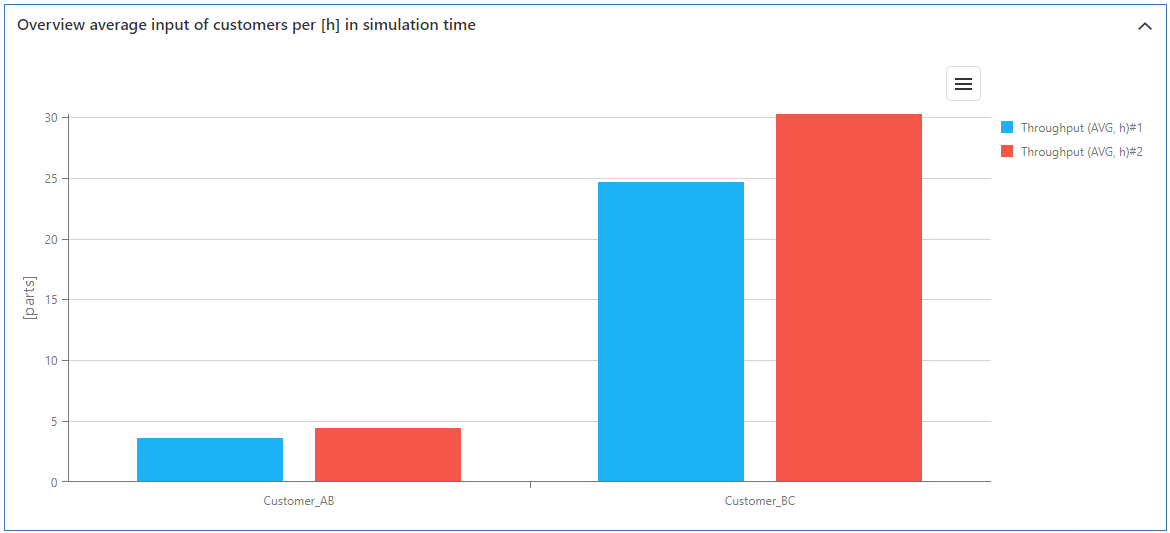
Figure 5 - Overview average input of customers per [h] in simulation time
5. Customer – Throughput parts (IO, REWORK) in [h]
As further detailed statistics, throughput statistics at part level are processed in the form of diagrams (analogous to processes per hour and per day).
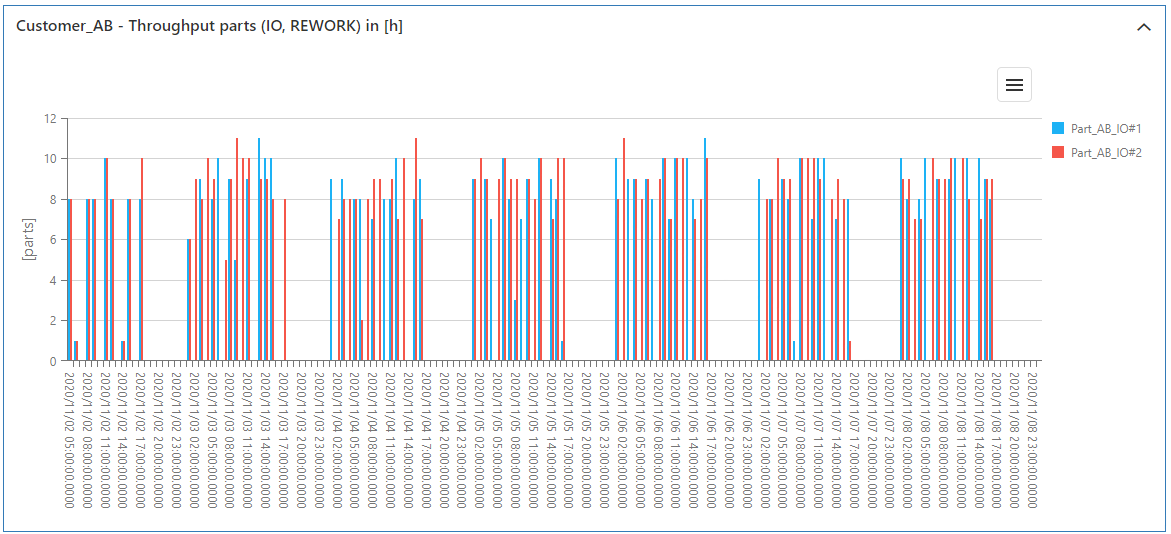
Figure 6 - Customer – Throughput parts (IO, REWORK) in [h]
6. Customer – Throughput parts (IO, REWORK) in [d]

Figure 7 - Customer – Throughput parts (IO, REWORK) in [d]
© SimPlan AG - Hanau District Court, Commercial Register (Part B) 6845 - info@simplan.de - www.simplan.de/en