This results section contains statistics for customer orders that could be processed. A customer order was processed when all required parts were delivered to the customer.
The throughput time for an order is defined from creation to receipt of the last part ordered.
Contents
1. Customer – Order throughput times (histogram with [orders])
3. Customer – Order throughput times - finished order with threshold
Figure 1 shows an overview of individual distributions of the key figure customer order statistics.
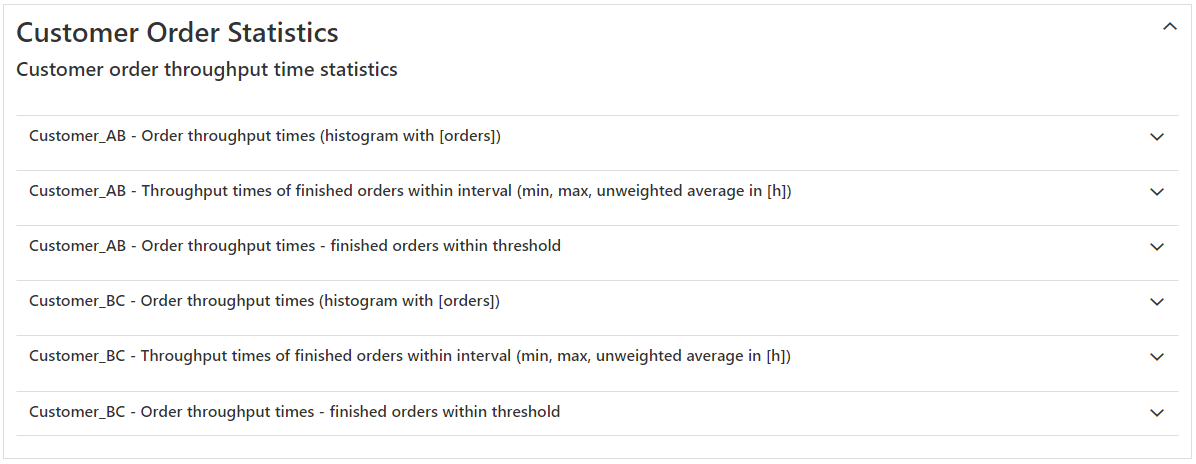
Figure 1 - Customer order statistics overview
1. Customer – Order throughput times (histogram with [orders])
Figure 2 shows a histogram with the number of orders per throughput time interval.
This means that all orders that could be completed within a parameterizable time span or class width are cumulated accordingly on the y-axis.
The time interval for the X-axis can be set using the customer parameter Histogram interval order throughput time.
The display of the histogram also includes only filled classes. Unfinished orders are also listed in a separate class.
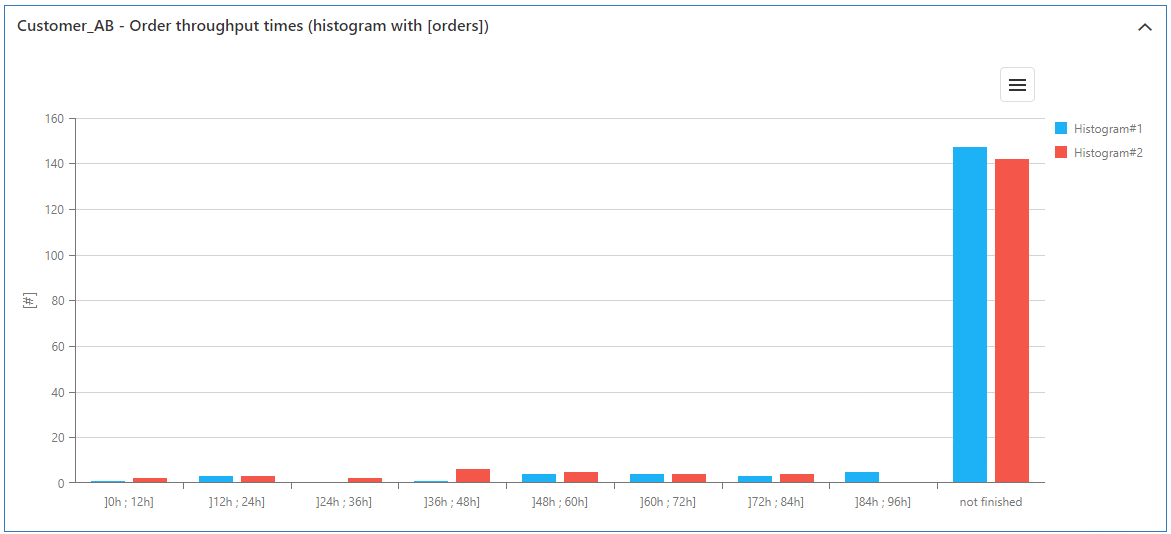
Figure 2 - Customer – Order throughput times (histogram with [orders])
2. Customer – Throughput times of finished orders within interval (min, max, unweighted average in [h])
Figure 3 shows an overview of the throughput times of completed orders over time. The individual data series show the minimum, maximum and average (unweighted) throughput times of completed orders.
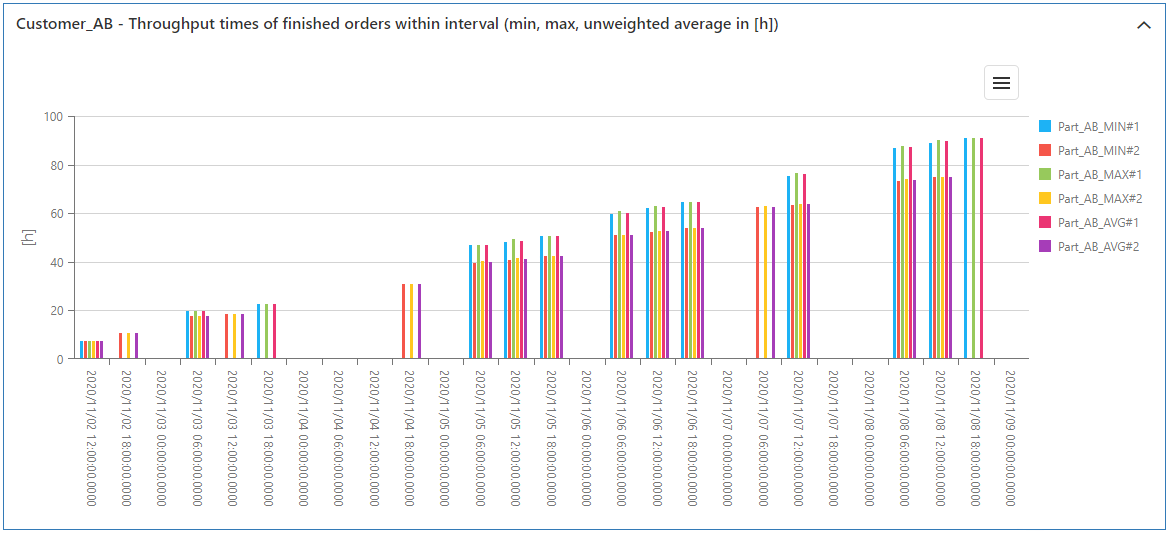
Figure 3 - Customer – Throughput times of finished orders within interval (min, max, unweighted average in [h])
3. Customer – Order throughput times - finished orders with threshold
Finally, a data table with an evaluation of the order throughput times is specified. In this way, the number of orders completed within a threshold value is evaluated for a customer.
The threshold value is determined using the parameter Threshold parameter in the customer object.

Figure 4 - Customer – Order throughput times threshold statistics
© SimPlan AG - Hanau District Court, Commercial Register (Part B) 6845 - info@simplan.de - www.simplan.de/en